At a Glance
- 209 to 78 days
- Median customer implementation time, a 63% reduction
- 12% to 50%
- First-pass quality, more than four times better
- 0.79%
- Share of elapsed time that was actual work at baseline
- 4 days
- To map current state, future state and the transformation plan
The Client
A healthcare e-learning platform serving hospital systems across the United States. New customer activation ran across seven departments - Sales, Platform, Product Management and Design, Implementation, Data Integration, Training and Operations - from the moment a contract was marked closed-won in Salesforce through to operations handoff.
The Challenge
It was taking an average of 209 days to implement a customer. A backlog of roughly 1,000 service request line items had built up, and throughput was not sufficient to meet the coming Q4 busy season. Customer satisfaction was falling, and with it the company's reputation.
Sixteen or more systems carried the work between departments - Salesforce, CPQ, NetSuite, Trello, Basecamp, SharePoint, OneNote, Power BI, Teams and email among them - none of which connected well to each other. Manual effort filled every gap between them.
The most telling problem was not any of those. It was that leadership had no evidence-based view of what to fix first. The project charter recorded the position in plain language: no clearly known solutions or root causes, and nobody knew where to start.
208 days of elapsed time containing 9.5 hours of work
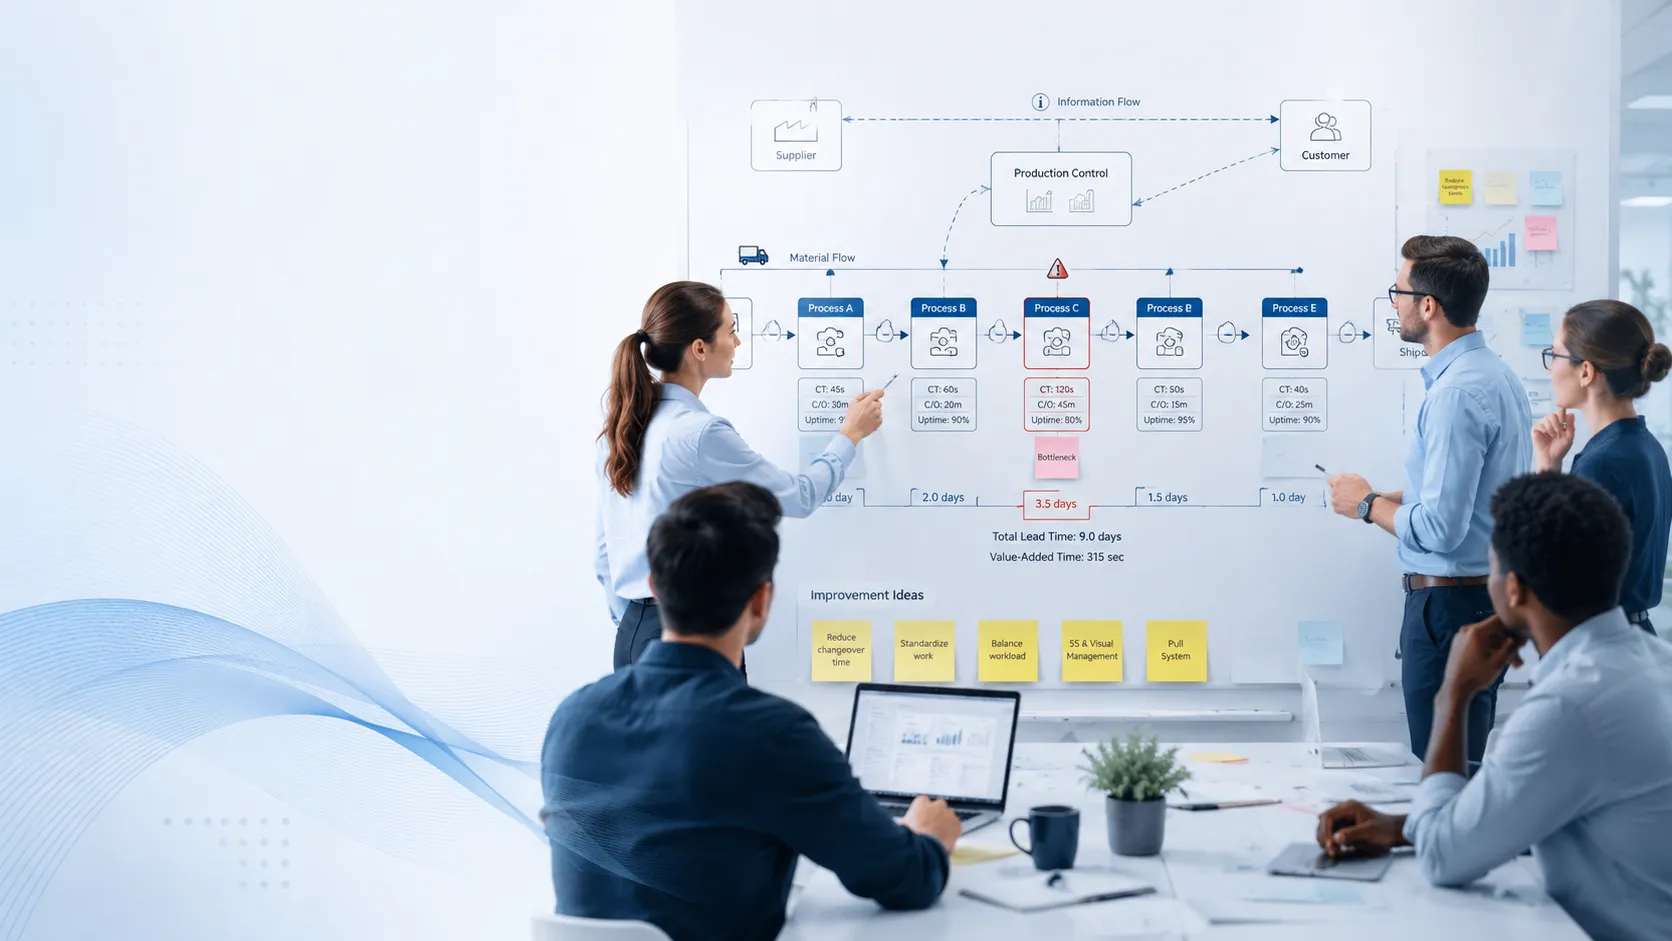
Mapping the full stream produced 1,189 hours of lead time against 565 minutes of actual touch time. An activity ratio of 0.79%. The process was not slow because anyone was working slowly - it was almost entirely waiting.
A backlog capacity could not clear
Around 1,000 service request line items were outstanding against throughput that would not meet Q4 demand. Each quarter of shortfall compounded into the next, and no amount of effort inside the existing process was going to close it.
Burnout across seven departments
Overwork, frustration and falling morale spanned multiple departments simultaneously. New implementation employees were taking twelve or more weeks to become productive, so adding people offered no near-term relief.
No agreed root cause to act on
Different departments held different theories and none had evidence behind them. Without a shared, measured picture of where time actually went, any improvement programme would have been an expensive guess.
What We Did
Scoped to one product rather than the whole platform
The map was deliberately narrowed to new-customer activation for a single product within a larger family. Renewals, premium implementations, clinical products and post-implementation requests were all placed explicitly out of scope. A narrow boundary is what makes findings specific enough to act on.
Set a baseline that excluded the pandemic
Baseline data was drawn from December 2019 through February 2020 and deliberately stopped before March 2020, so COVID-19 disruption could not distort the measurement. A baseline nobody can argue with is worth the effort of defining it carefully.
Separated champion, process owner and facilitator
The President and COO took the Value Stream Champion and sponsor role. The VP of Customer Service and Support owned the process as co-sponsor. Facilitation sat with an external consultant, with a Lean Six Sigma project manager validating the approach independently. Three distinct roles meant nobody was grading their own work.
Wrote the resistance into the charter
Two risks were recorded before the work started: implementation staff fearing job losses through automation, and low confidence carried over from earlier improvement efforts that had not delivered. Naming both in writing made them discussable instead of corrosive.
Mapped current state, future state and the plan in four days
Current state mapping over two days, future state over the following two, and the transformation plan the same day it finished. The deliverable set included a definition of done, a product and process matrix, a SIPOC, both value stream maps, and a prioritized project list.
Prioritized by impact and separated quick hits from structural work
The transformation plan distinguished changes that could land immediately from those requiring engineering investment — mandatory field completion at contract close, a dedicated implementations operations role, systematic assignment by weighted complexity, site shell build automation, automated data validation, customer readiness scoring, and status dashboards replacing manual chasing.
Closed with a succession plan rather than a report
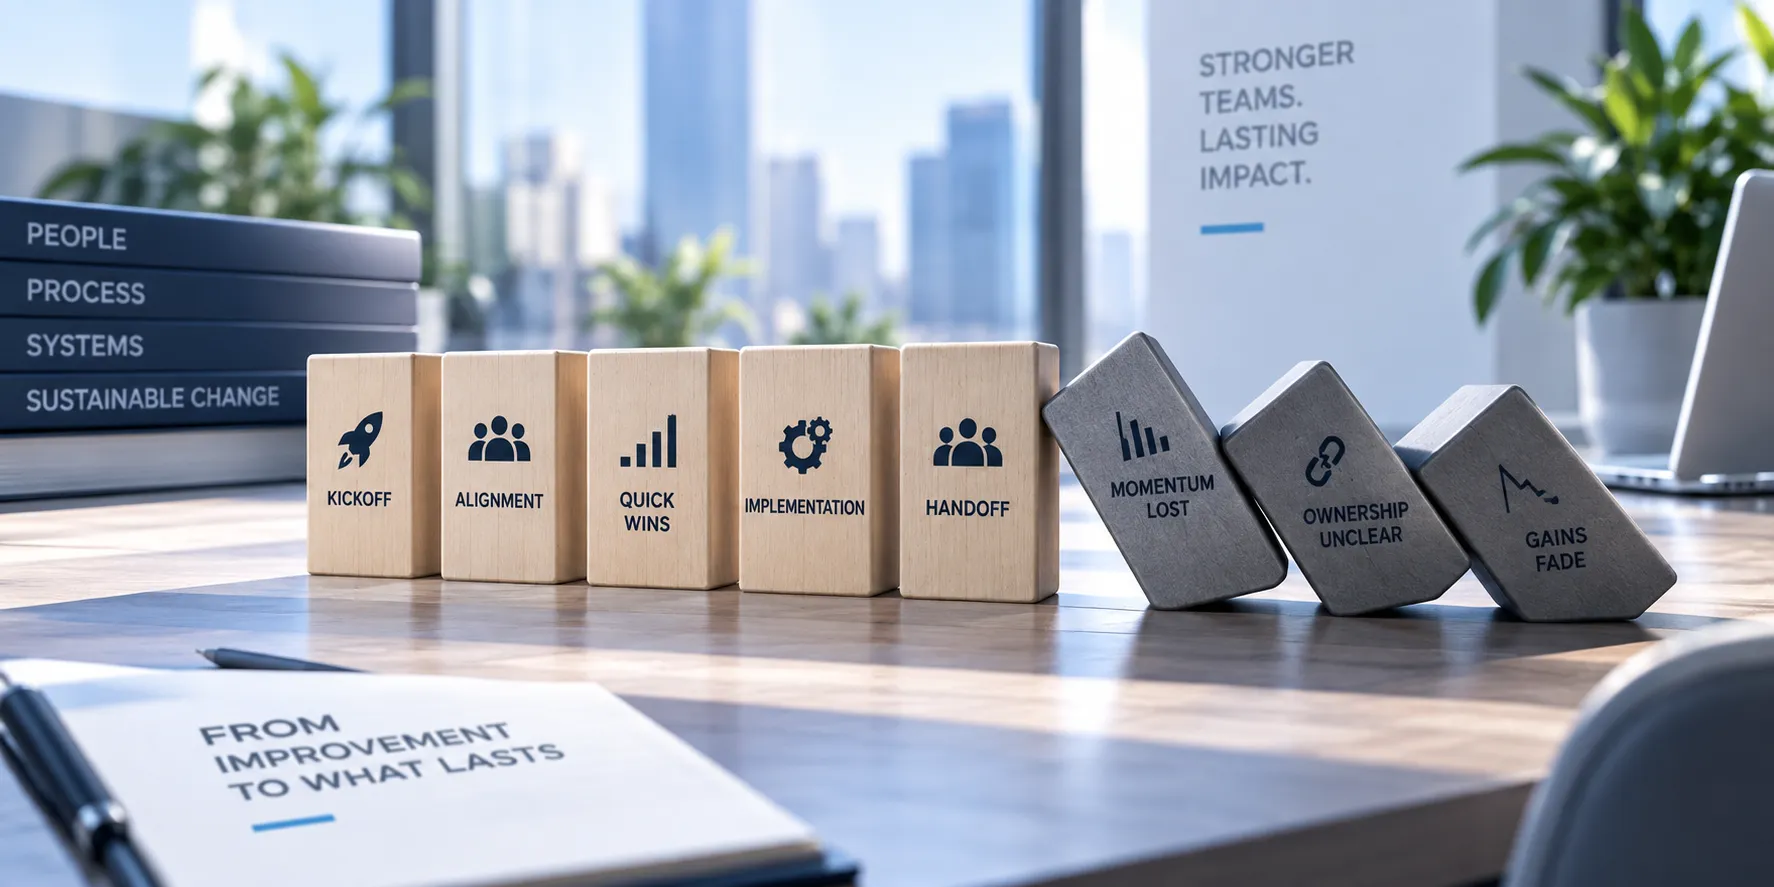
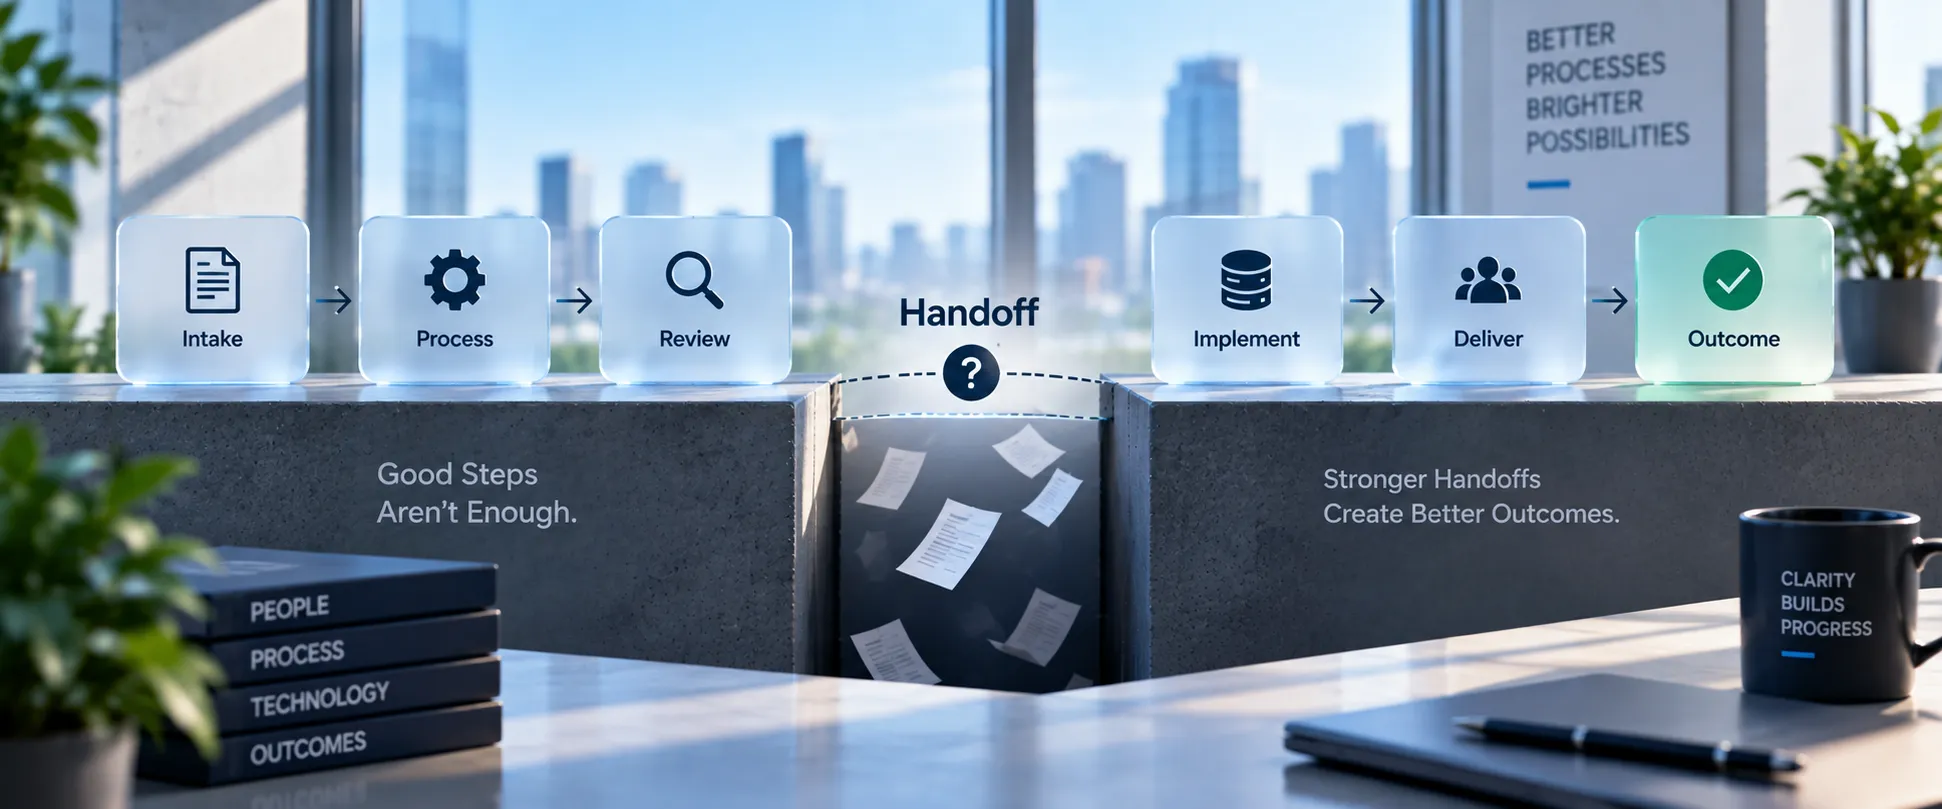
The final phase established continuous quality improvement capability inside the client's own team, with process ownership and measurement systems handed over, so the gains would not depend on the consultant remaining.
The Results
Median customer implementation time fell from 209 days to 78, a reduction of 63%. First-pass quality rose from 12% to 50%, more than four times better, which meant the majority of implementations stopped requiring rework that had previously been invisible in the schedule.
The improvements that produced this were not heroic. Mandatory fields at contract close removed a class of downstream clarification. A dedicated operations role gave sales a single interface instead of several. Systematic assignment by weighted complexity replaced ad hoc triage. Automating site shell builds and data validation removed manual steps that had been absorbing days of elapsed time for minutes of work.
The engagement closed by establishing continuous quality improvement capability within the client's own organization, so the measurement systems and process ownership that produced the result stayed in place afterwards.
Start the conversation